Investor Relations
Financial Summary
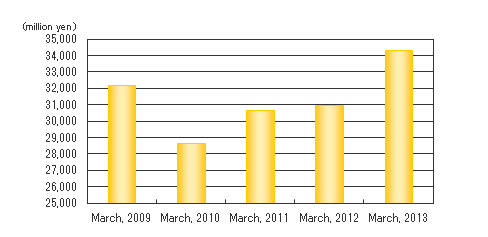
Net Sales

| March 2009 | March 2010 | March 2011 | March 2012 | March 2013 | |
|---|---|---|---|---|---|
| Consolidated | 32,181 | 28,651 | 30,669 | 30,968 | 34,313 |
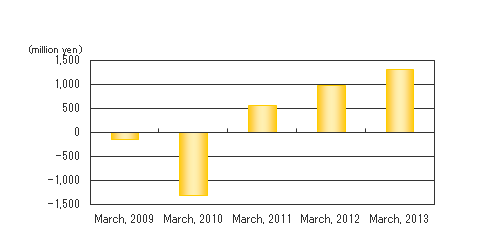
Operating Income

| March 2009 | March 2010 | March 2011 | March 2012 | March 2013 | |
|---|---|---|---|---|---|
| Consolidated | -147 | -1,321 | 555 | 971 | 1,309 |
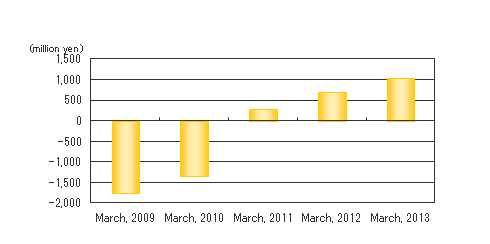
Ordinary Income

| March 2009 | March 2010 | March 2011 | March 2012 | March 2013 | |
|---|---|---|---|---|---|
| Consolidated | -1,767 | -1,355 | 294 | 702 | 1,029 |
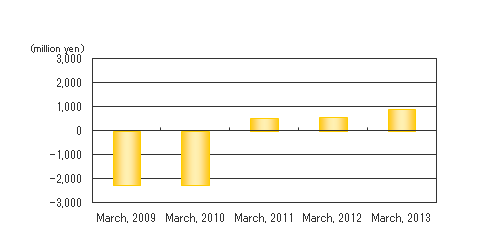
Net Income

| March 2009 | March 2010 | March 2011 | March 2012 | March 2013 | |
|---|---|---|---|---|---|
| Consolidated | -2,263 | -2,237 | 538 | 574 | 903 |
[Note:]
The statements on this website with respect to the Company's current plans, strategies and decisions include forecasts of future business results. Such statements are based on management's assumptions and decisions in light of the information currently available. Since these forecasts involve risks and uncertainties, actual results may differ materially from these. Therefore you should not place undue reliance on them.